Our Retail Intelligence reporting with Power BI provides clients with uncommon insights regarding core shelving KPIs, pricing insights, actionable productivity metrics, and an analytic path to value that drive sales.
Our Industry Leading Clients
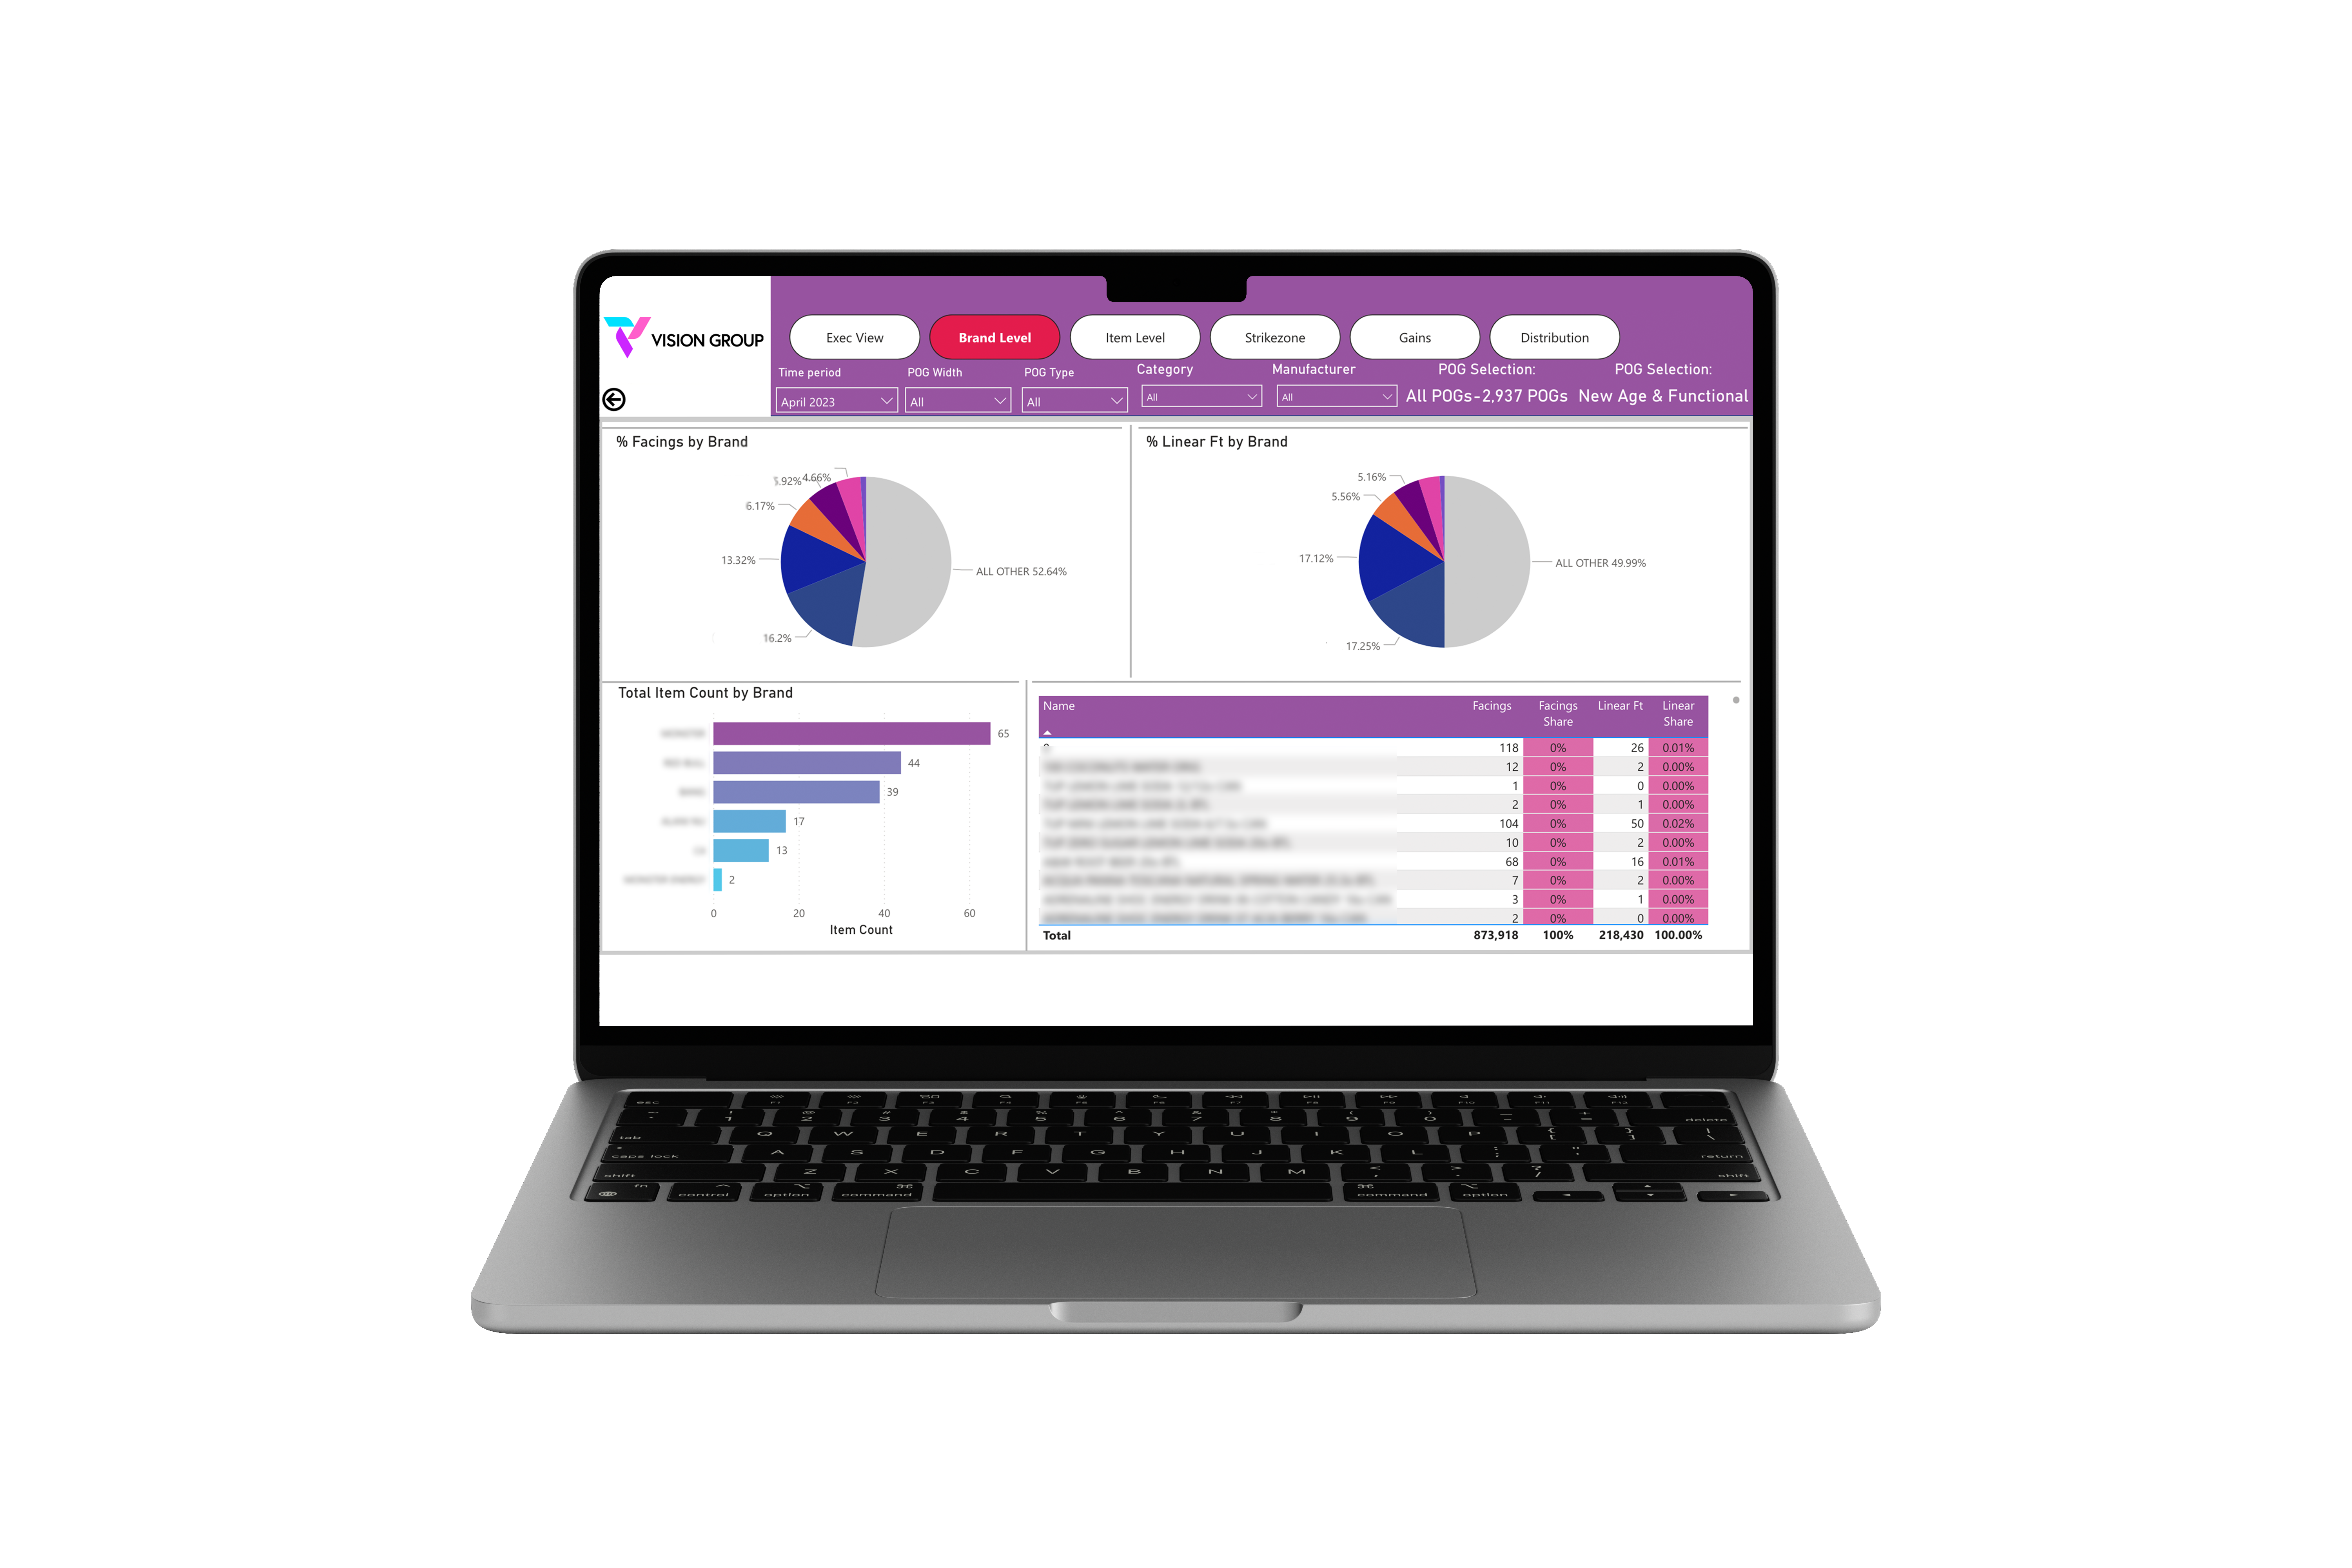
POG roll-up report
Track Planogram Efficiency
Our POG Roll-Up Report analyzes store specific planograms, or visual representations of a retailer’s shelf layout, to understand clients share of items, facings, linear space and item assortment. Tracking changes over time and leveraging sales data to drive insightful, actionable analysis.
Our POG Roll-Up Report ingests planogram data and provides analysis on manufacturer’s KPIs:
Product Assortment by banner, by store
Facings Allocation by banner, by store
Product Placement by store
Linear Share of Shelf by store
Core SKU Analysis
Gains/Losses over time
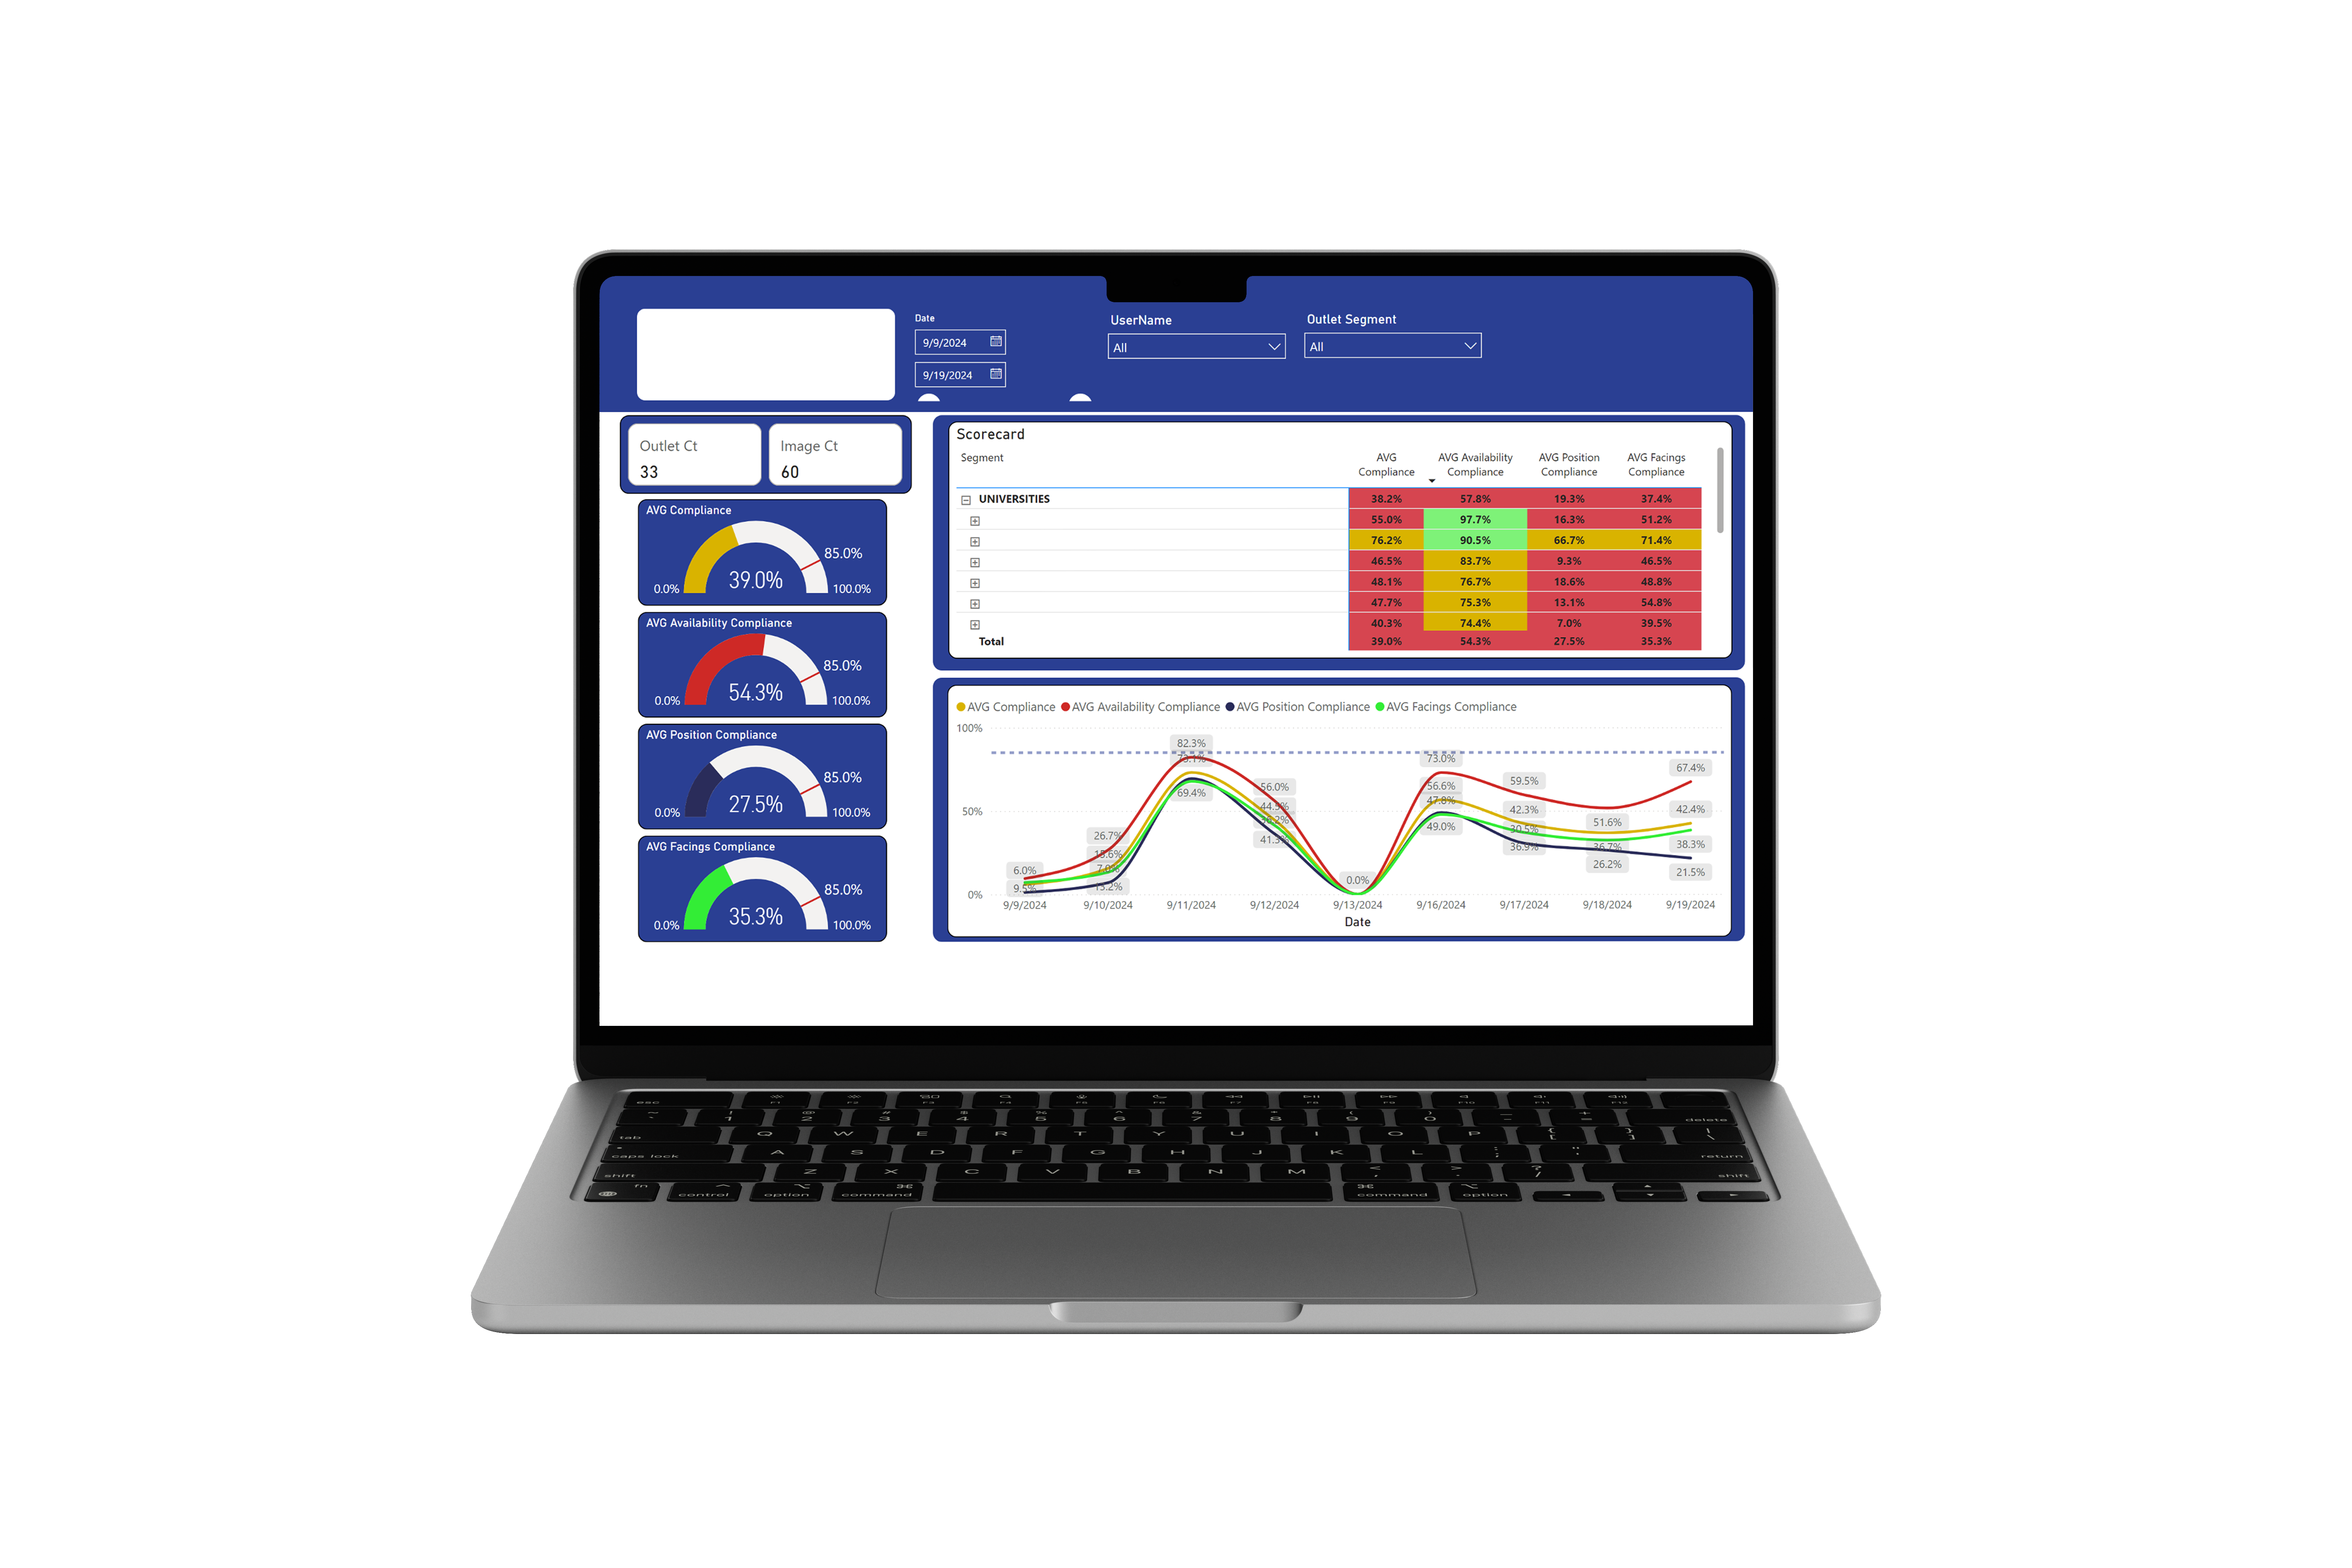
POG Compliance Report
Compare Your Planograms to Realograms
Leveraging Store360 IR Results, our POG Compliance Report compares the Realogram (ROG) which is the state of the retail merchandising at any given time, to the planogram, which is the planned merchandising to measure merchandising adherence opportunities. Our POG Compliance solution ingests planogram data and Store360 IR data and provides comparison analysis on manufacturer’s KPIs: